Analyse the experiment
End-point and time-course workbenches, plate design, TRUPATH compilation and exports for Prism, Excel and CSV.
The experiment,
in context.
Illustrative workflow · Synthetic measurements
Pharmacology, connected
Analyse assays, explore structure–activity relationships and keep your team’s compound knowledge together. Ligara connects plate-reader data, chemistry and biology in one research workspace.
01 / Map the experiment
Import the reader file. Map compounds, concentrations, controls and replicates on the plate. The design stays with the run, ready to check when you return to it.
96- and 384-well layouts, reader-specific imports and automatic reading with researcher confirmation.
Import & plate mapping02 / Inspect the response
Fit the response, then inspect the points behind it. Review replicates, uncertainty and assumptions before deciding what the result means.
End-point dose-response and kinetic time-course analysis. Raw measurements stay available.
Analysis & methods03 / Review it together
Move from a fitted response to the compound behind it. Explore structures, compare activity across targets and return to the runs, replicates and methods that produced each result.
Private drafts, shared projects and a lab database keep individual analysis connected to team knowledge.
The shared workspace04 / Explore the next structure
Draw and inspect molecules, compare R groups and explore chemical space. Experimental discovery tools add local property prediction and molecule generation to the researcher’s toolkit.
See the real screensStart at the plate, the compound or the target. The same workspace connects the analysis to the scientific context.
End-point and time-course workbenches, plate design, TRUPATH compilation and exports for Prism, Excel and CSV.
Compound records, a molecular sketcher, R-group analysis, chemical-space maps and structure–activity tools.
Private drafts, shared projects, lab records, sequence biology, inventory and controlled partner sharing.
Inside the product
Explore the tools in the latest app. These fresh captures use synthetic data and an example molecule.
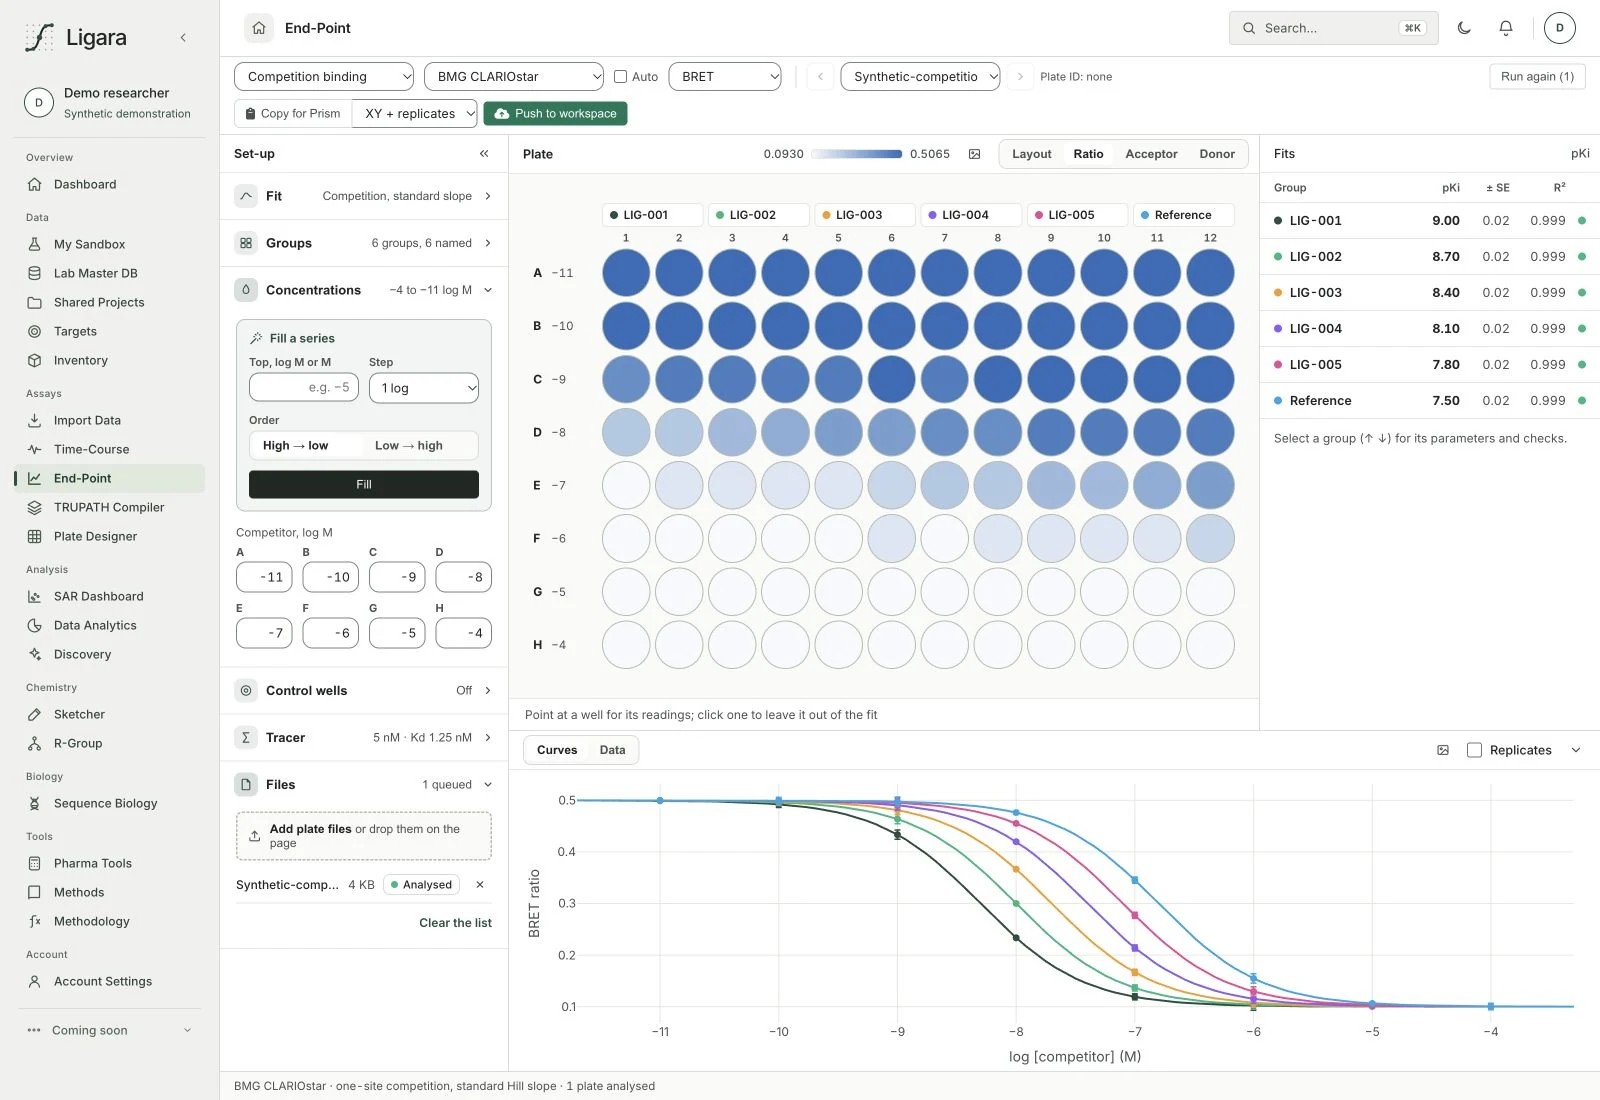
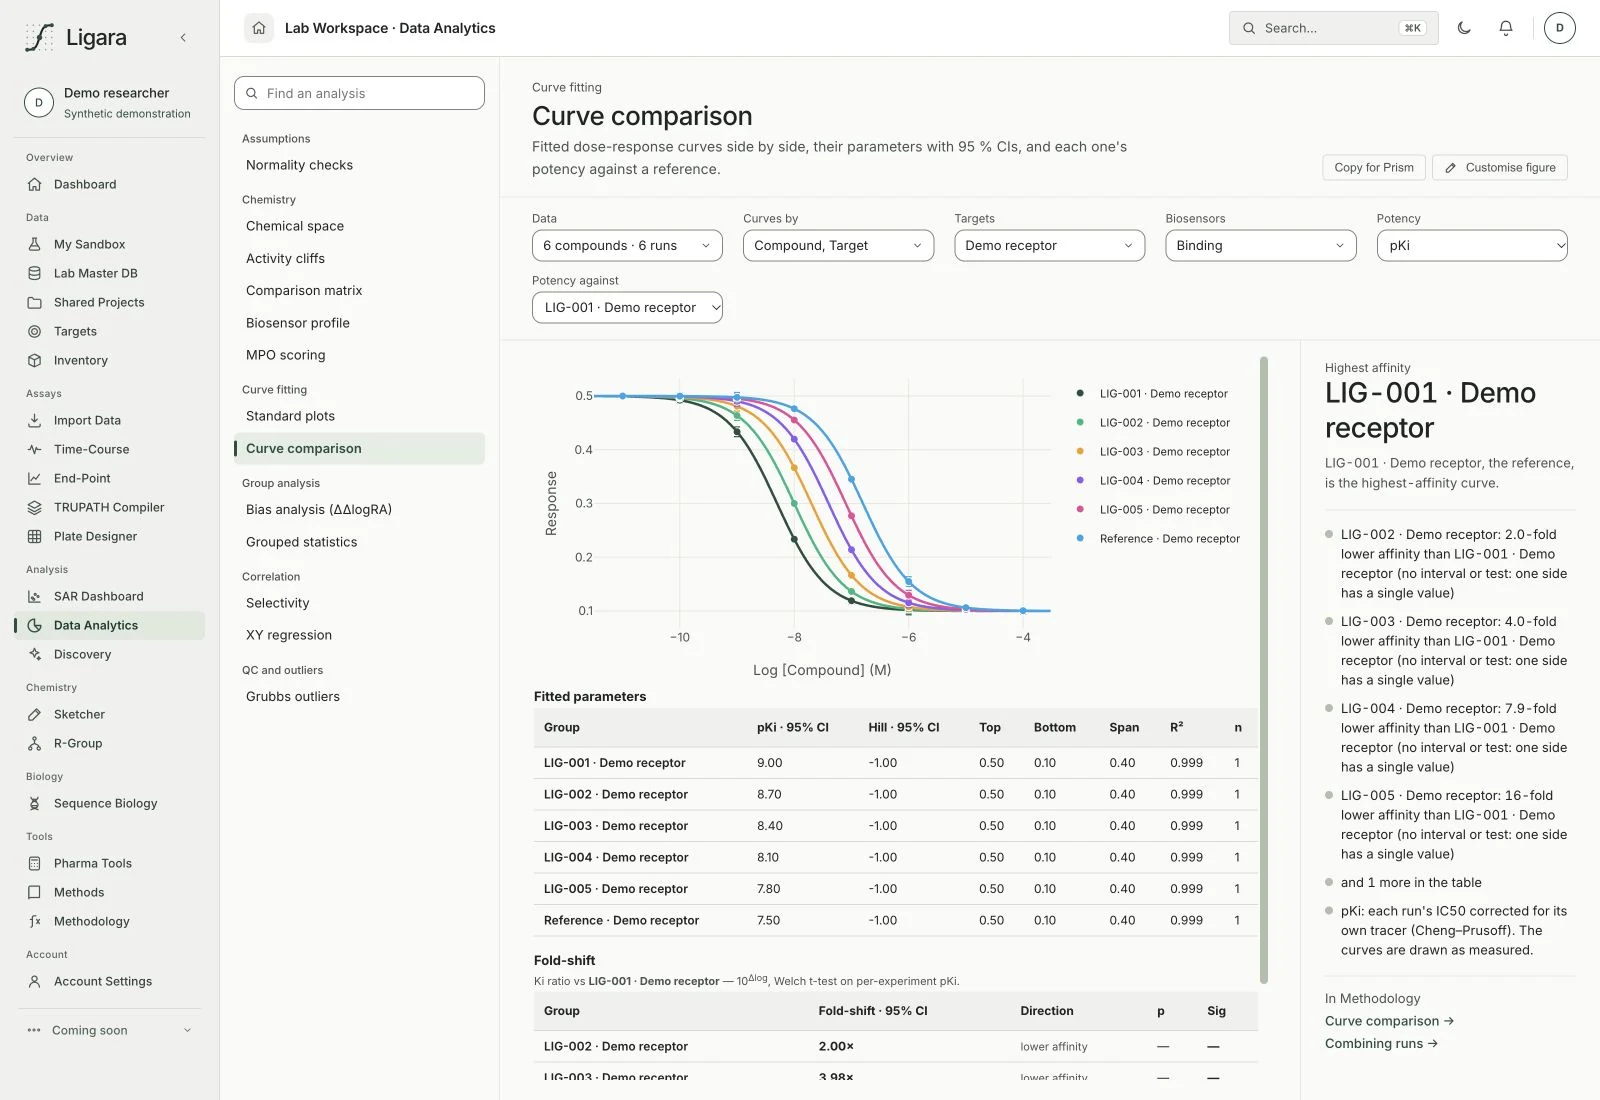
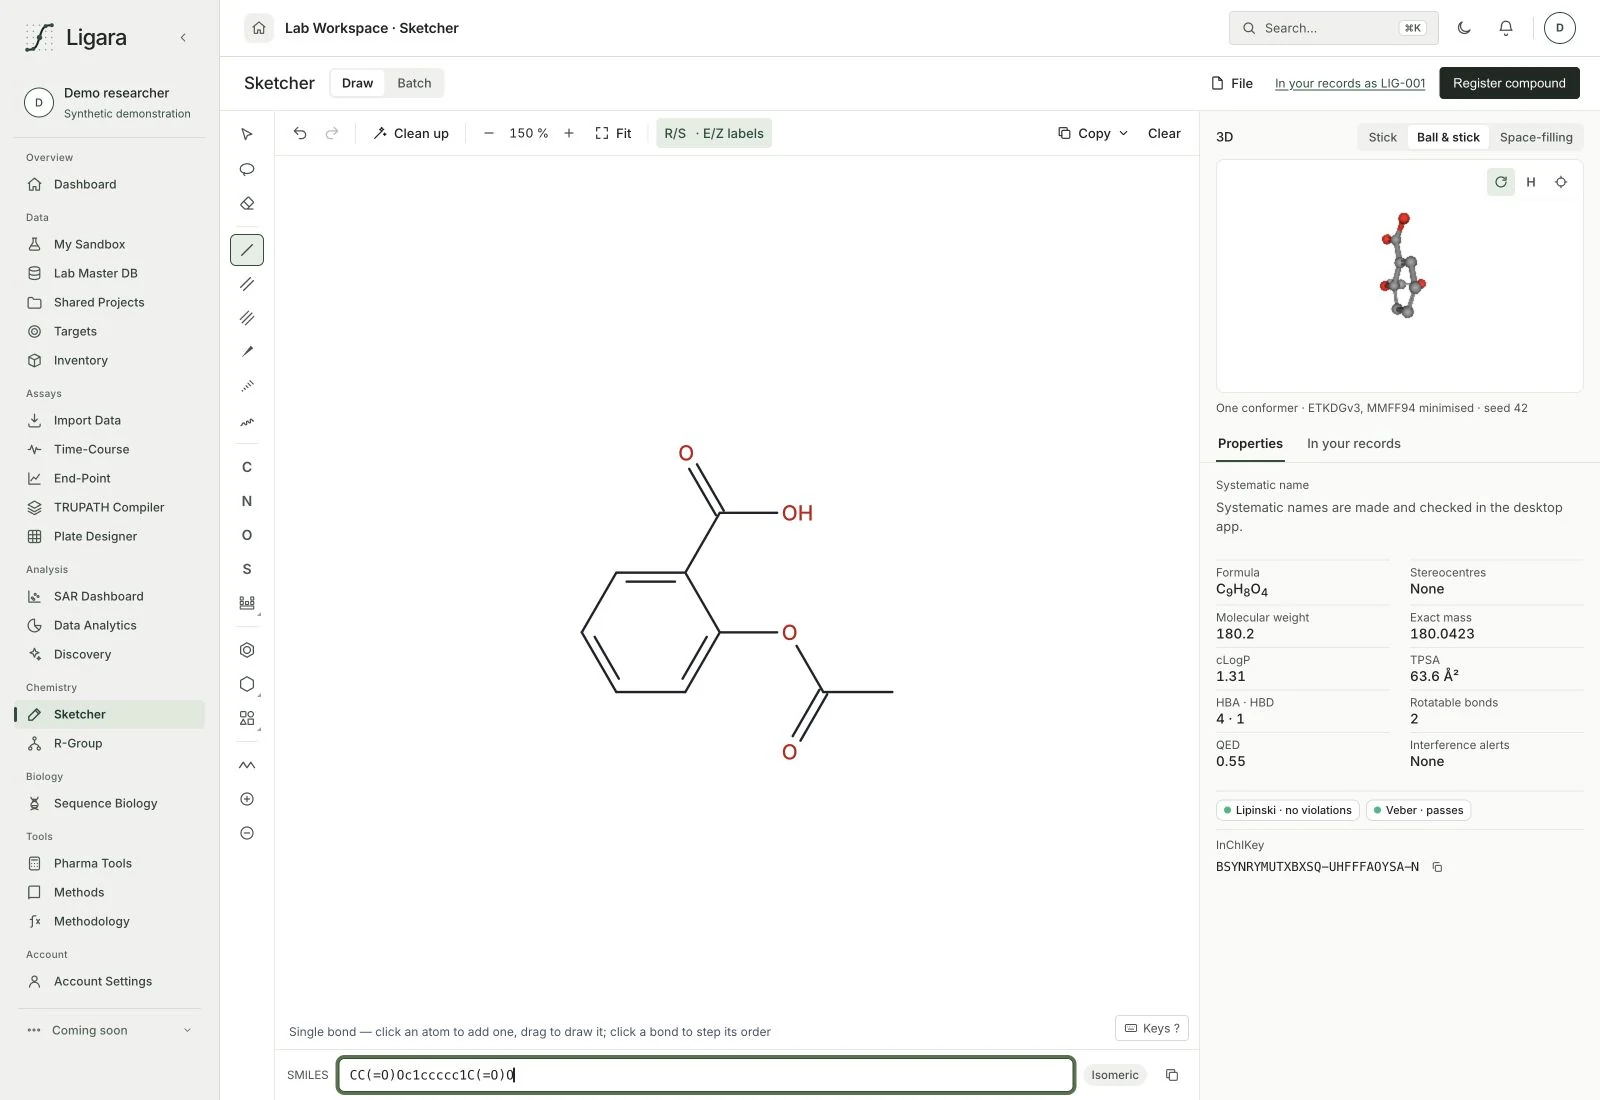
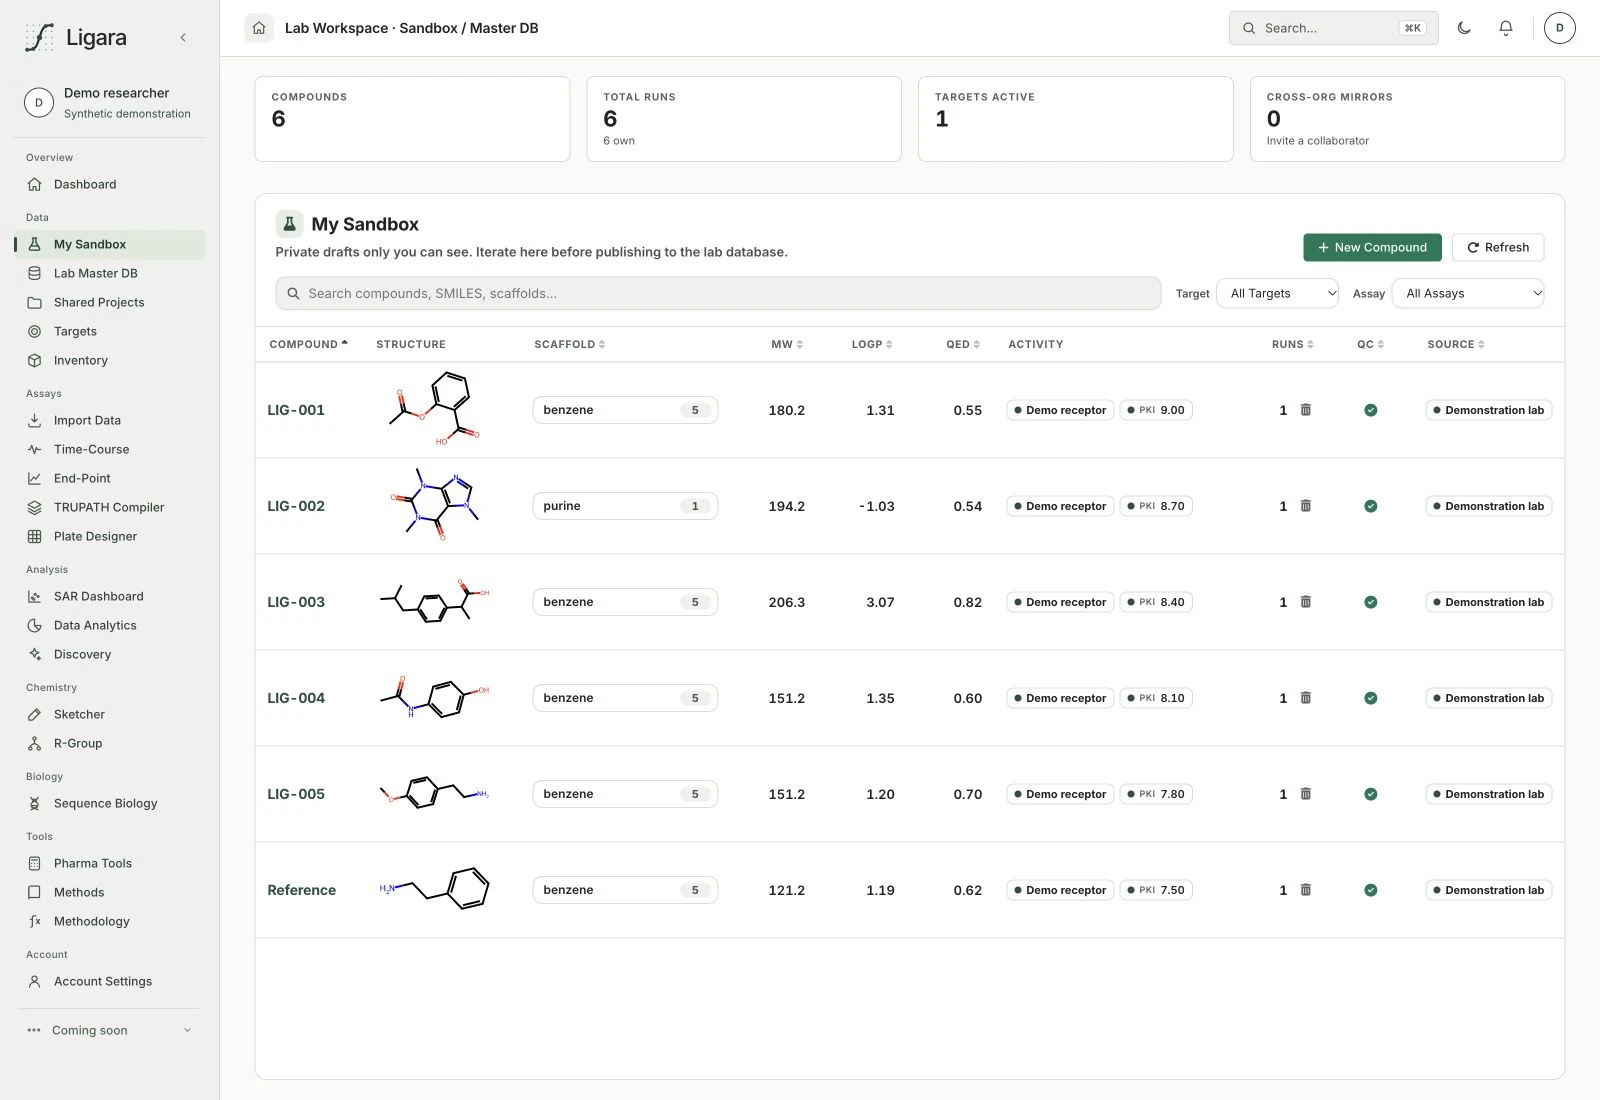
Documented fitting methods. Raw measurements available for review.
Explore the platformThe problem we are working on
A compound is more than a row in a spreadsheet. Connect its structures, assay history, target biology and physical samples, so your next discussion starts with the evidence already in view.
Ligara for biotech teamsReturn to the plate map, measurements and fit statistics behind a compound’s activity.
Compound workspaceFitting algorithms, assumptions and failure modes are documented in the product.
Fitting methodsCore fitting and chemistry run locally. Workspace storage and optional lookups use the network.
Data flow & securityAaron Dexter and Zac Baylis are building Ligara together.
A pharmacology researcher at Cambridge, bringing the experience of running and analysing laboratory assays.
A software engineer studying Business Analytics at MIT, building Ligara alongside his studies.
See it with your workflow
Walk through import, plate mapping and analysis with us. A synthetic or anonymised export is a good place to start.
Book a demo