The Ligara platform

Plate-reader analysis,
with the compound in view.

Import a reader file, map the experiment and fit the response. Keep the run with its compound and target so your team can find it again.

Book a demo
01 / Import

Import your plate-reader export.

Bring in native plate-reader exports and map the experiment in a visual plate designer.
  • Native parsers for SpectraMax, CLARIOstar, PHERAstar, Tecan Spark and FLUOstar Omega.
  • A generic wavelength-matrix reader for compatible grid exports.
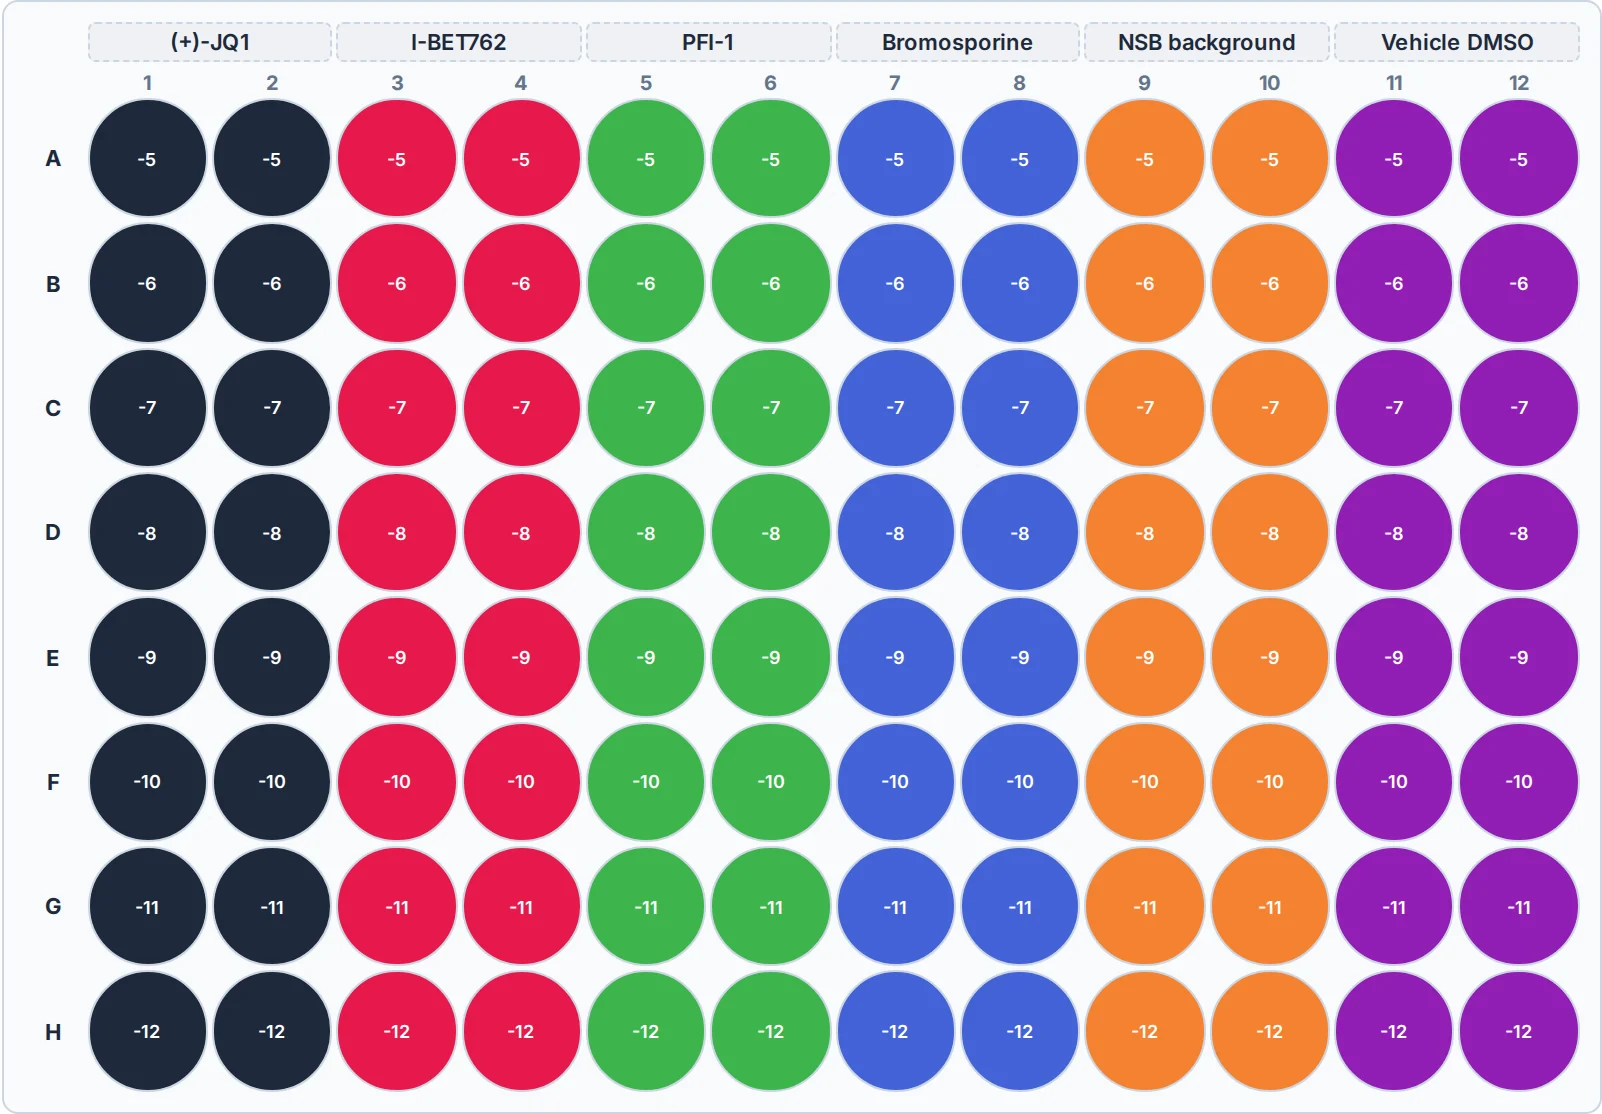
  • Map compounds, concentrations, controls and replicates across 96 wells.
96-well plate map with compound and concentration groups
A plate design keeps the experiment’s structure explicit. Representative sample data.
02 / Analyse

Fit the response.
Inspect the replicates.

Run end-point dose-response analysis, kinetic time-course analysis and grouped compilation workflows without losing the original context.
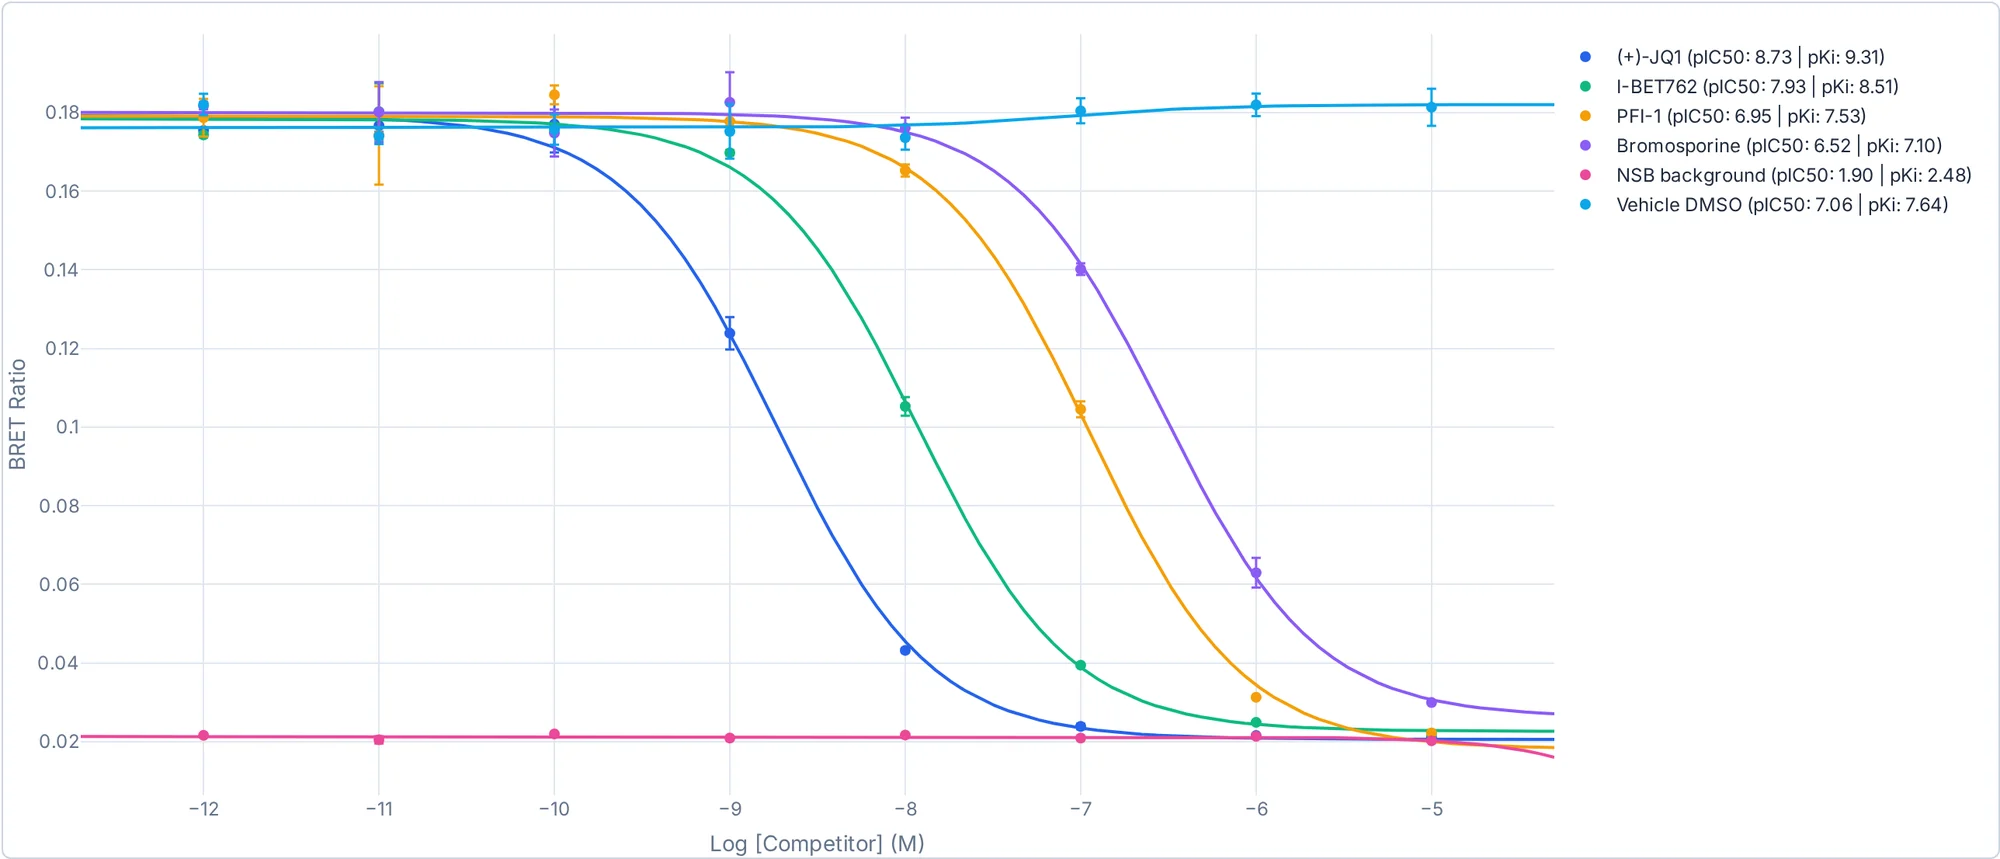
  • Three- and four-parameter Hill fits, plus hyperbolic saturation fitting.
  • Time-course traces, baseline correction and area-under-curve analysis.
  • Inspect and exclude individual replicates, then refit while retaining the raw data.
Dose-response curves fitted to representative competition binding data
Inspect the fit alongside your measurements. Representative sample data.
Fitting methods

Read the method behind the fit.

Levenberg–Marquardt fitting with an analytic Jacobian, parameter standard errors and 95% confidence intervals. In-app methodology pages explain the algorithms, assumptions and failure modes. Statistical tests include Welch’s t-test, ANOVA and non-parametric alternatives.

Research-use and validation information
03 / Chemistry

Compare structure
and activity.

Explore the chemistry alongside the pharmacology. Core structure calculations run in your browser using RDKit WebAssembly.
  • 2D and 3D structure views, descriptors, fingerprints and Tanimoto similarity.
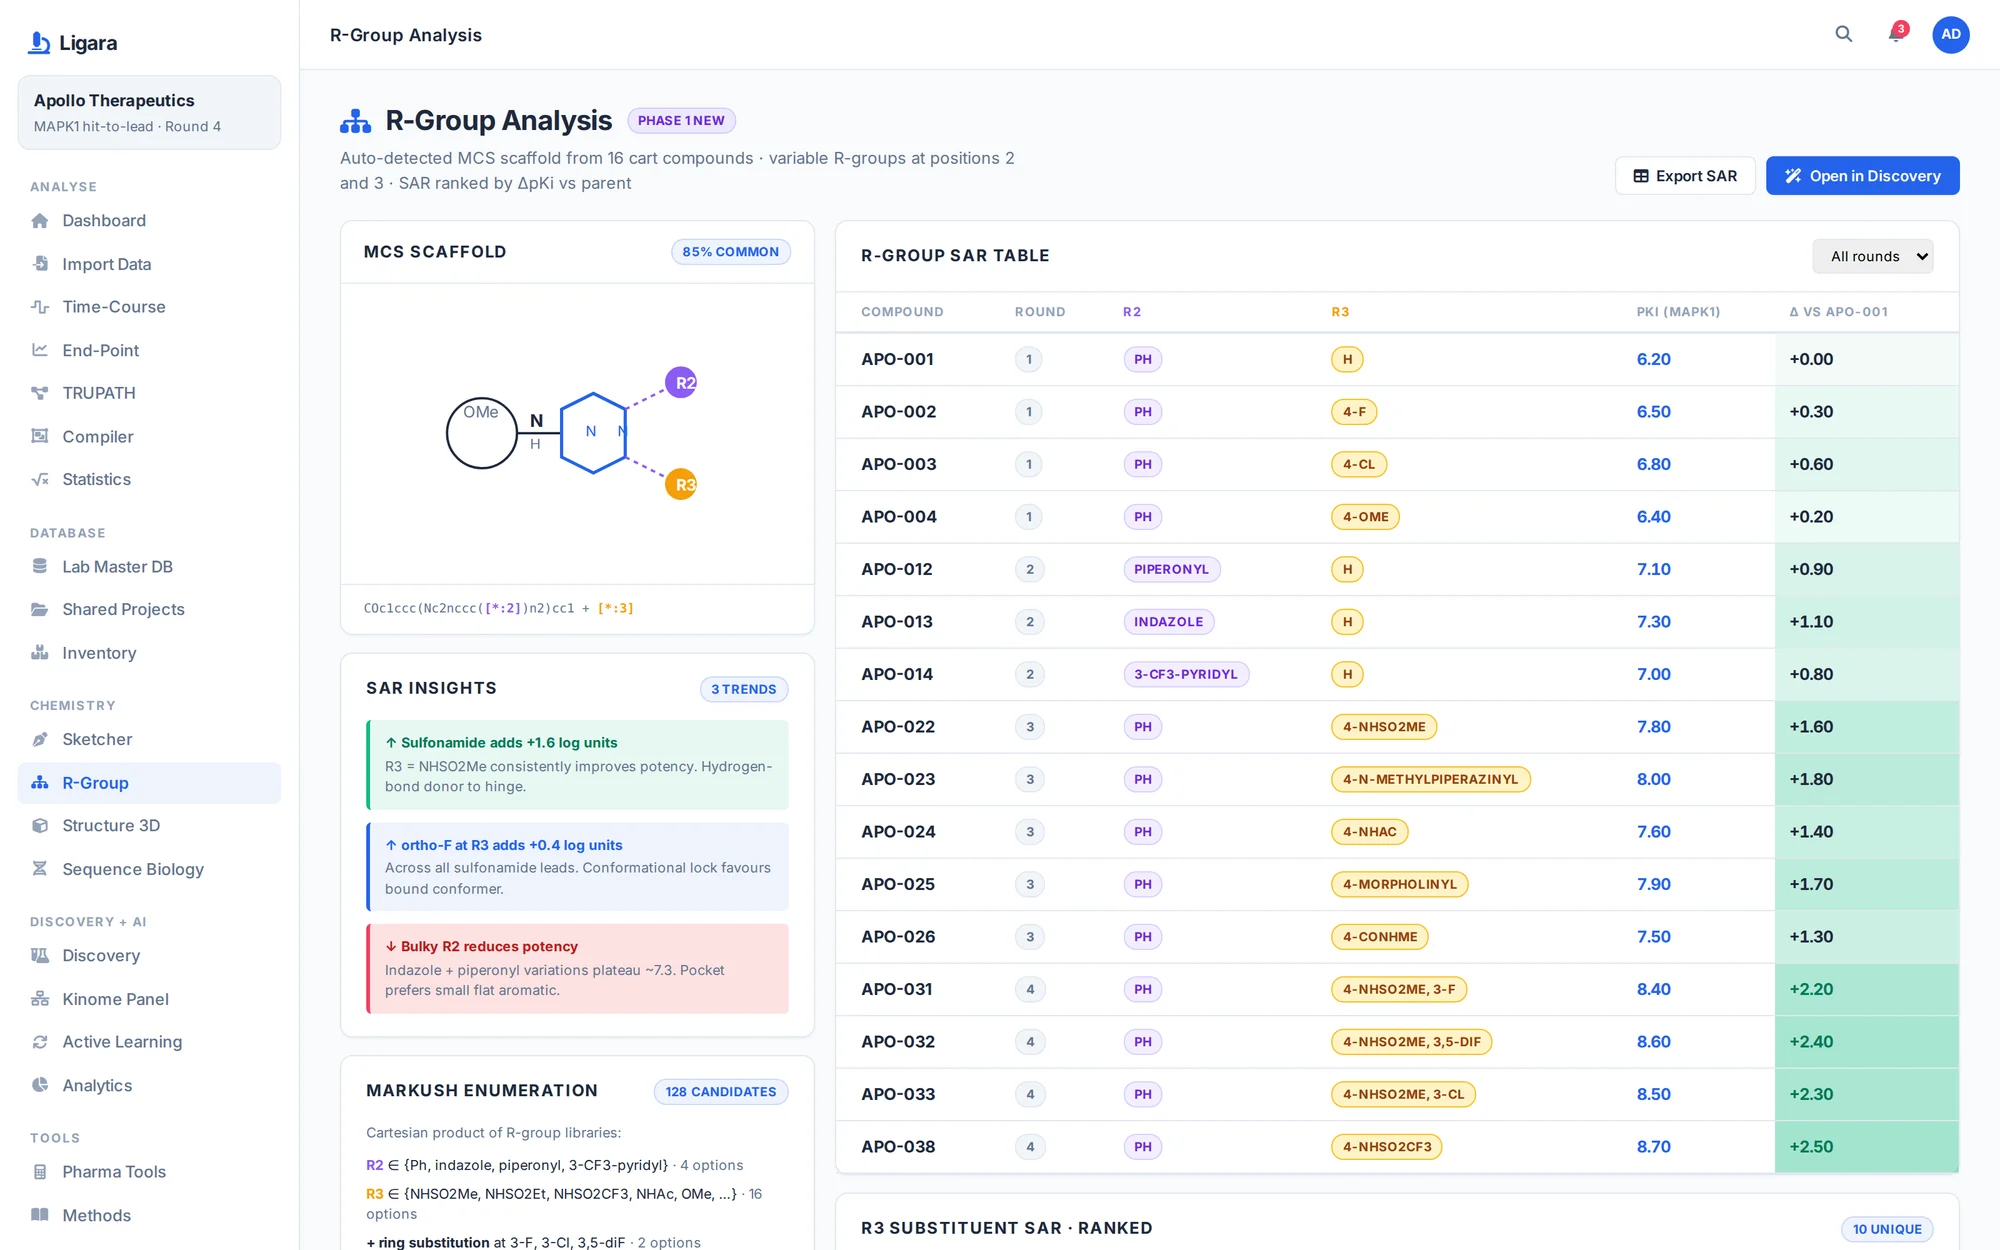
  • R-group decomposition, maximum common substructure and PAINS flags.
  • Chemical-space maps, activity cliffs and target-selectivity views.
R-group decomposition view comparing compound substituents
Compare chemical structure alongside activity. Representative sample data.
04 / Workspace

Find a result through
its compound or target.

Organise runs by compound, target and biosensor. Work in a personal sandbox, share with a project and publish approved records to your organisation.
  • Keep plate maps, traces and fit statistics attached to the run.
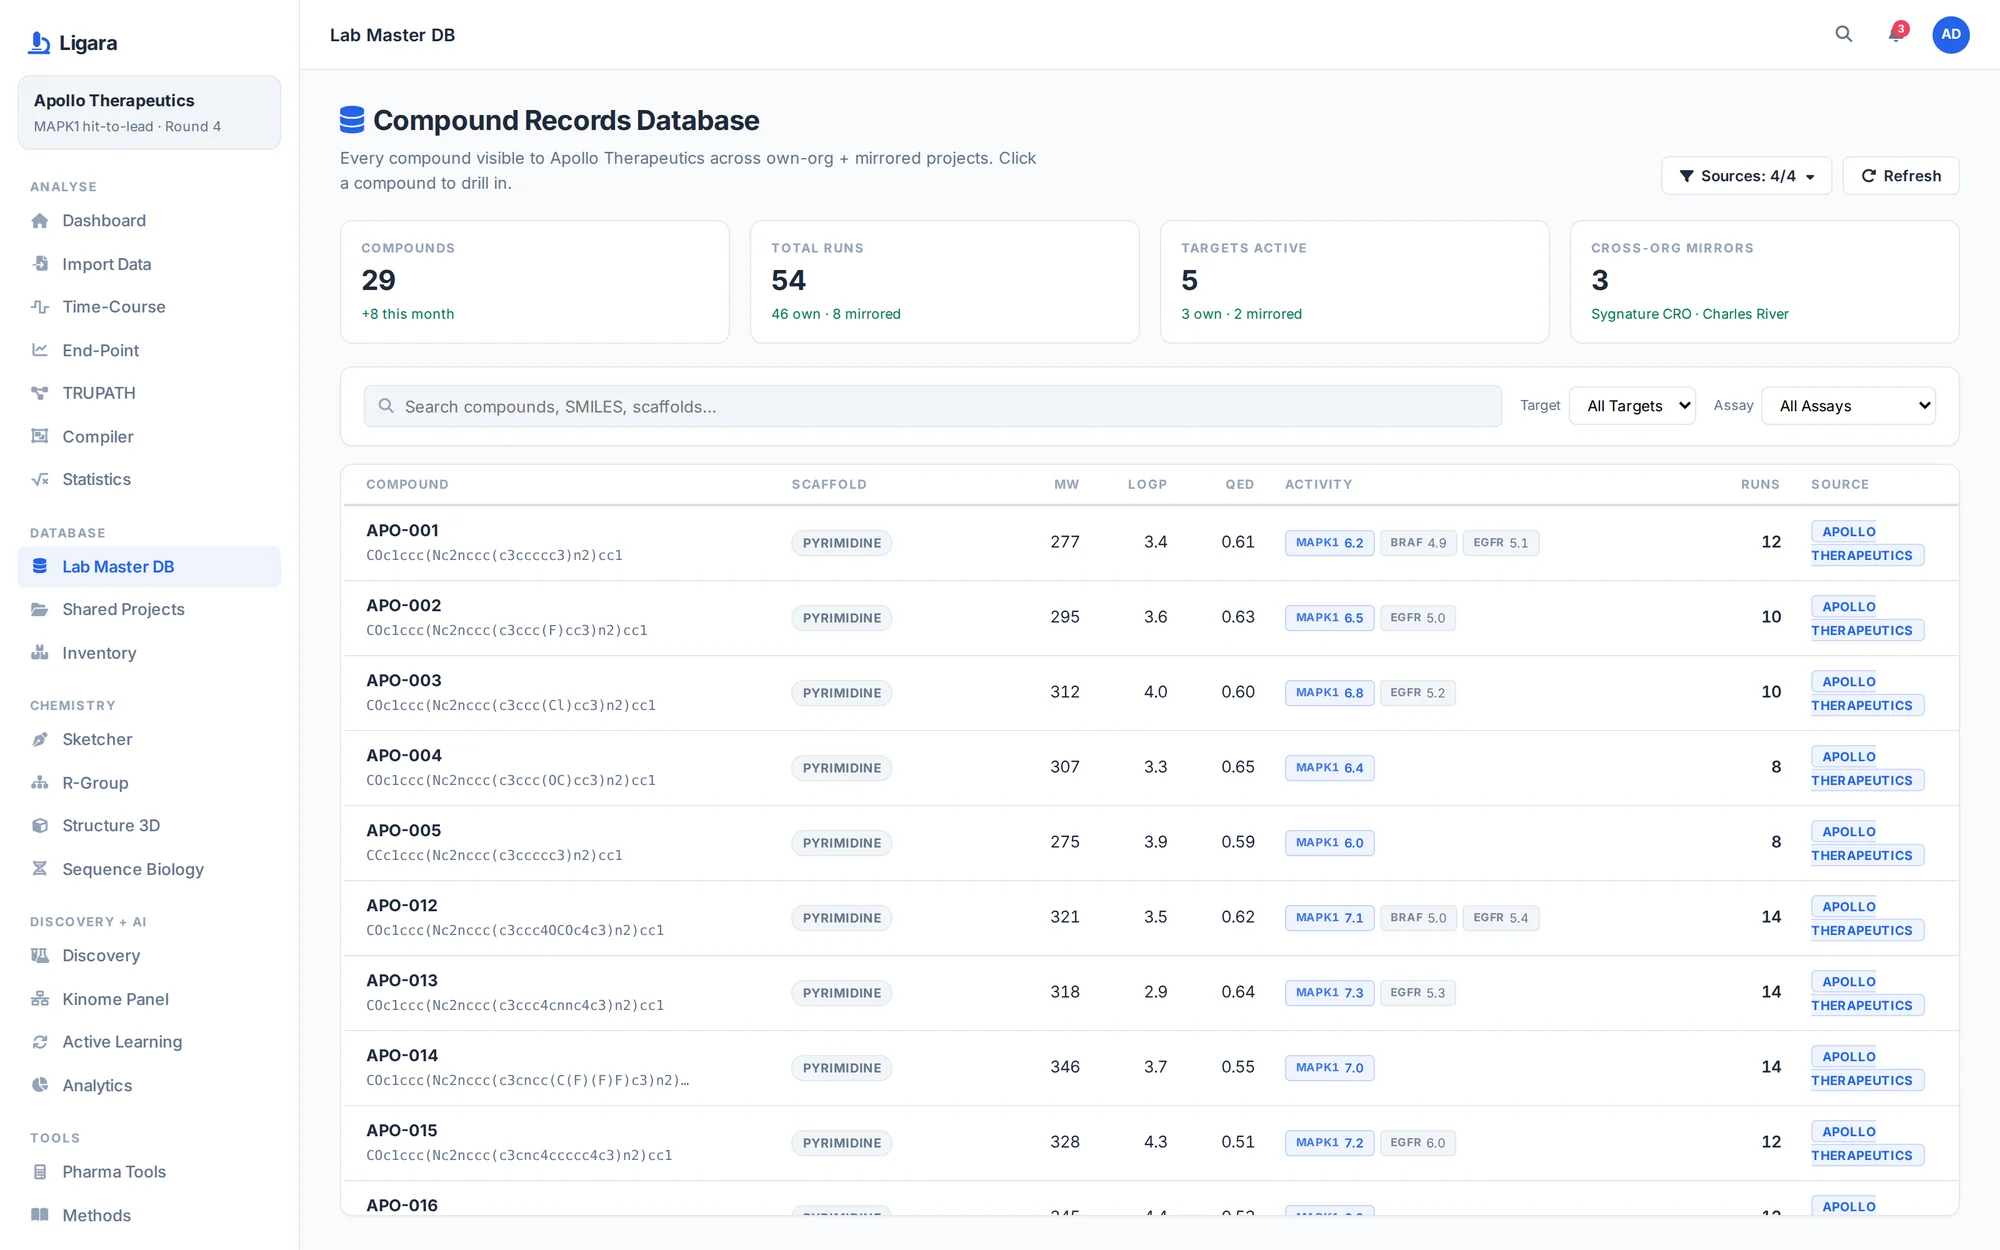
  • Explore compound and target views across experiments.
  • Save analysis recipes that can be re-derived from current data.
Compound registry with assay activity and chemical structures
Search your team’s compound knowledge. Representative sample data.
05 / Collaborate

Share a project
with a research partner.

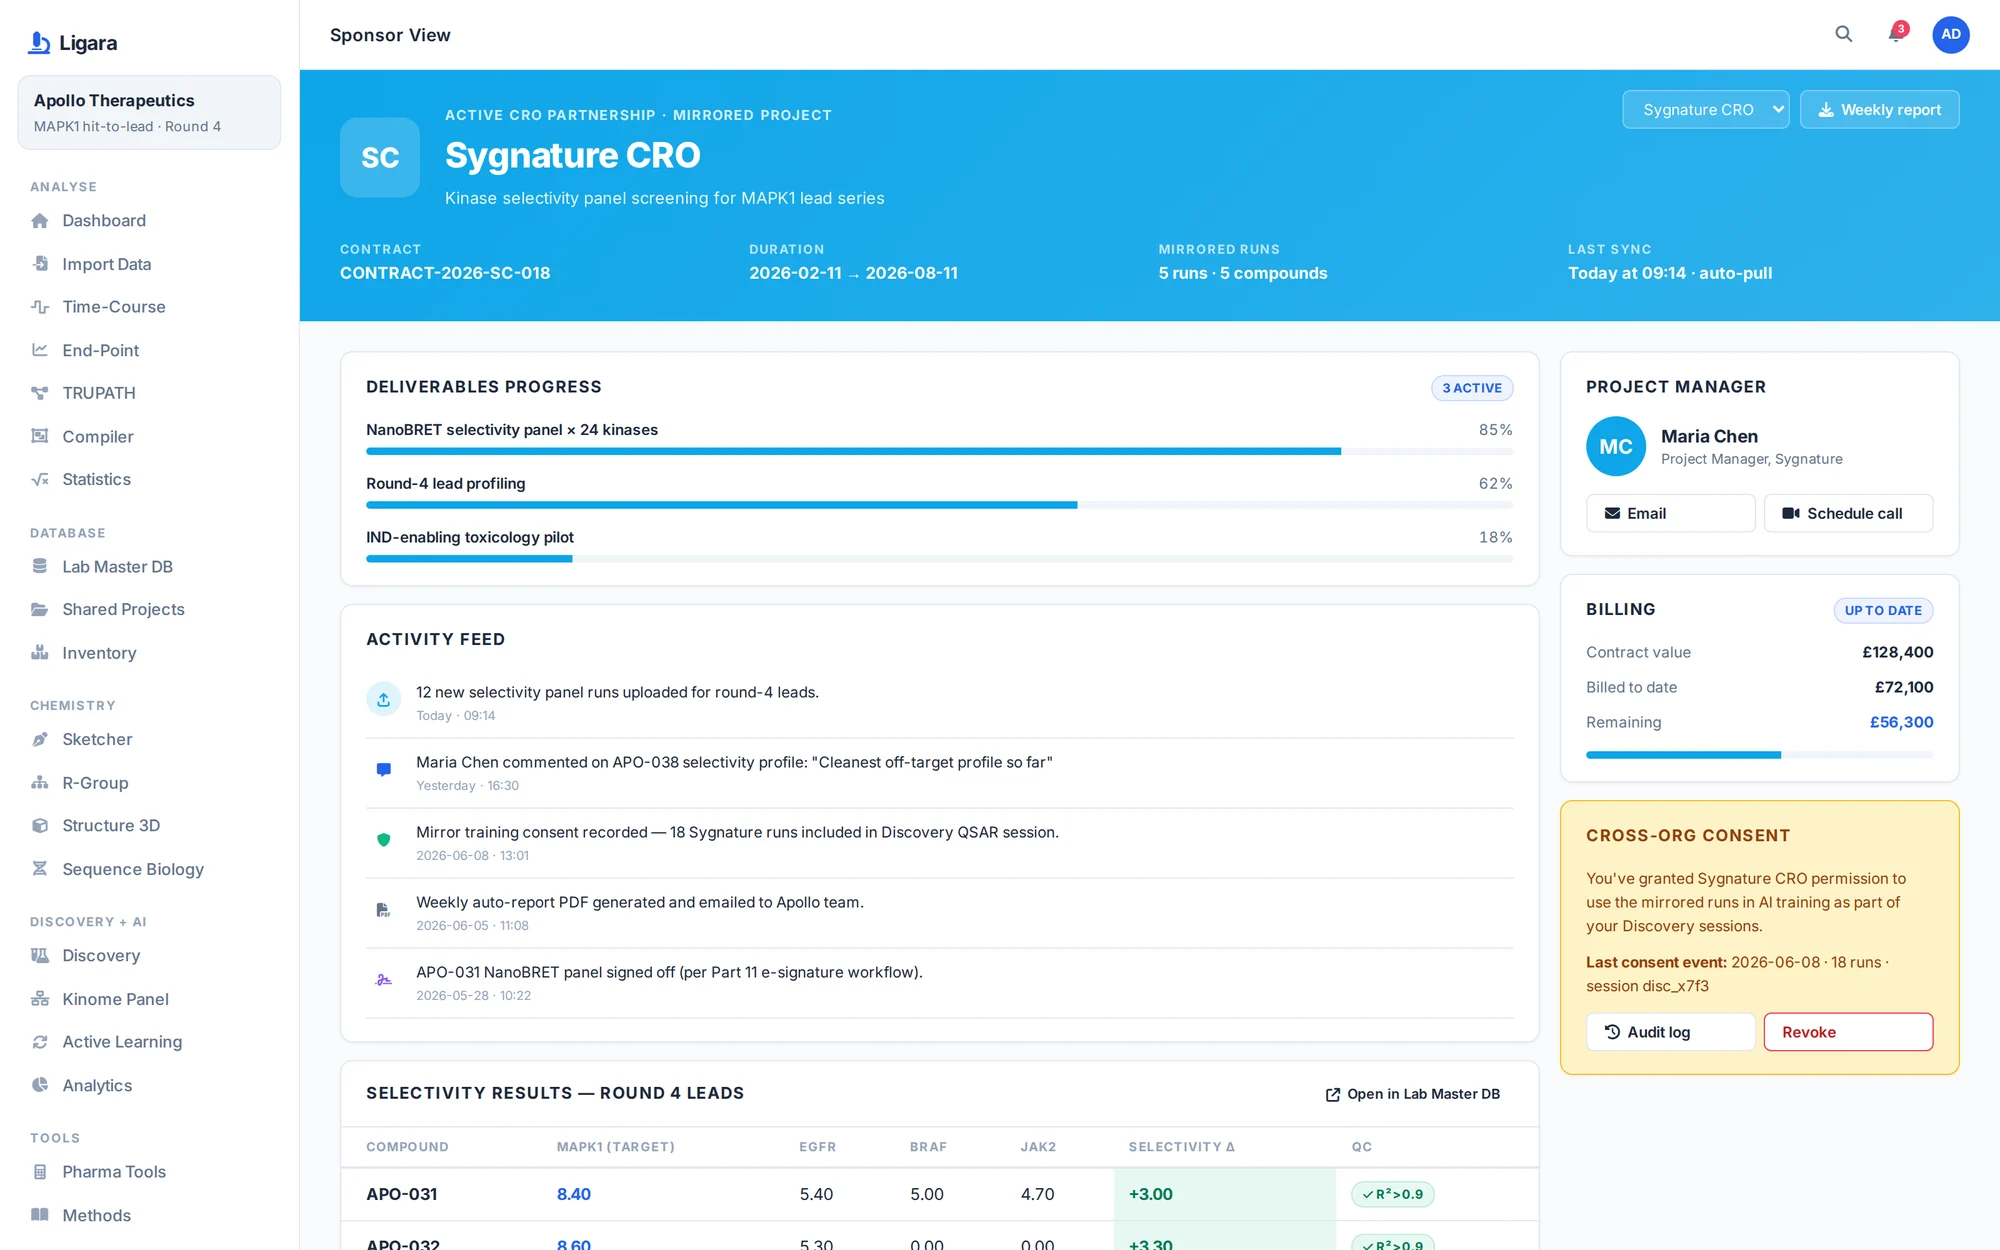
Share project data through read-only, attributed mirrors between organisations. Either side can revoke a mirror.
  • Organisation and project access policies are enforced in the database.
  • Mirrored records retain their source organisation.
  • Sponsor views bring the client’s programme into focus.
Sponsor view showing programme deliverables and partner activity
A programme view for sponsor collaboration. Representative sample data.

Inventory and notebook links.

Compound and biology inventory, aliquots, constructs and linked notebook entries help connect the experiment to the materials behind it.

Access and deployment.

Ligara supports browser-based analysis and desktop workflows. Book a demo to confirm the deployment and access arrangements for your team.

Exploratory tools.

Local ADMET sidecars are separate from the core analysis. The Discovery engine is a proof of concept, not a validated discovery service.

Core chemistry and fitting run locally. Workspace storage and optional external lookups involve network requests. See the full data flow.
Book a demo

See a plate file through to a fitted result.

Use a synthetic or anonymised plate export to walk through import, mapping and analysis. We’ll discuss access and deployment for your team.

Book a demo